Personnel statistics
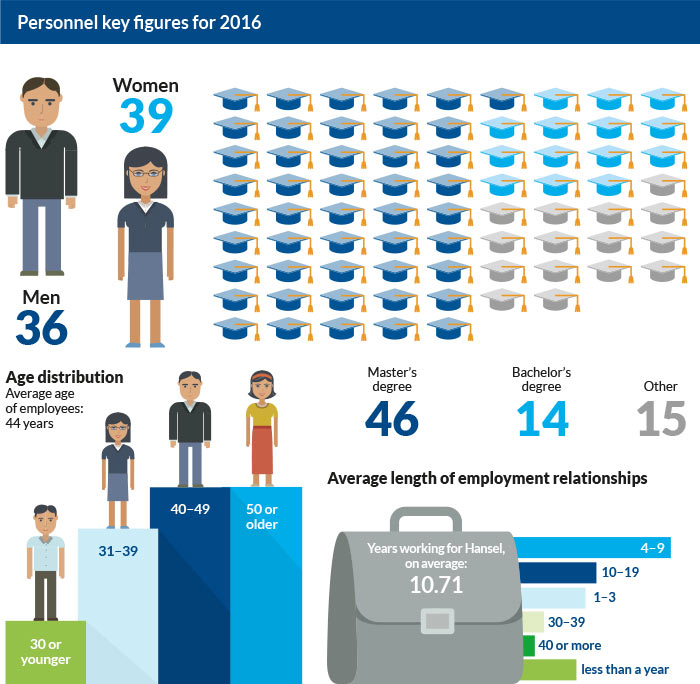
At the end of 2016, Hansel Ltd employed 75 people. During the year, ten people were hired and nine resigned. Hansel’s position as a leading player in procurement acted as a springboard for several professionals to move on to new challenging positions. An exit interview was conducted with people who resigned to determine how they had enjoyed working for Hansel, how the work community could be developed, and possibilities for professional growth.
Since 2015, the distribution of personnel by gender, age distribution and average duration of employment has been presented for all employment relationships that were effective at the end of the financial year. In previous years, these were only presented for full-time employees at the end of the financial year. The change in calculation method does not affect the personnel key figures in any significant way.
Number of personnel
|
2016 |
2015 |
2014 |
2013 |
2012 |
| Number of personnel at the end of financial period (FTE) |
72 |
74 |
77 |
73 |
71 |
| Average number of personnel during the financial period (FTE) |
73 |
73 |
75 |
71 |
69 |
| Valid employment contracts on 31 December |
75 |
76 |
80 |
79 |
78 |
| Valid permanent contracts on 31 December |
75 |
74 |
77 |
77 |
73 |
| Valid fixed-term contracts on 31 December |
0 |
2 |
3 |
2 |
5 |
| Full-time fixed-term contracts on 31 December |
0 |
0 |
2 |
1 |
2 |
| Part-time fixed-term contracts on 31 December |
0 |
2 |
1 |
1 |
3 |
| Full-time employment contracts (fixed-term and permanent) on 31 December |
73 |
74 |
79 |
78 |
75 |
| Parental leave, on average |
1 |
1 |
2 |
4 |
5 |
| Permanent employment contracts on 31 December, % |
100.0 |
97.4 |
96.2 |
97.5 |
93.6 |
| Fixed-term employment contracts on 31 December, % |
0.0 |
2.6 |
3.8 |
2.5 |
6.4 |
Employees by gender
As required by law, Hansel has an equality plan, presenting measures for ensuring equality and preventing discrimination. The company monitors trends and differences in salaries and the representation of men and women in the various types of jobs.
|
2016 |
2015 |
2014 |
2013 |
2012 |
| Men |
36 |
38 |
34 |
34 |
33 |
| Women |
39 |
38 |
45 |
44 |
42 |
Average duration of employment
| Years of service |
2016 |
2015 |
2014 |
2013 |
2012 |
| 40 or over |
2 |
2 |
5 |
5 |
3 |
| 30-39 |
3 |
3 |
3 |
4 |
6 |
| 20-29 |
0 |
0 |
0 |
0 |
0 |
| 10-19 |
16 |
15 |
9 |
6 |
1 |
| 4-9 |
31 |
32 |
33 |
33 |
33 |
| 1-3 |
14 |
19 |
23 |
24 |
23 |
| Less than a year |
9 |
5 |
6 |
6 |
9 |
| Total |
75 |
76 |
79 |
78 |
75 |
Employees by age
Employee turnover
|
2016 |
2015 |
2014 |
2013 |
2012 |
| New employment relationships |
10 |
8 |
11 |
12 |
12 |
| of which fixed-term contracts |
1 |
5 |
6 |
7 |
3 |
| Terminated contracts |
11 |
11 |
10 |
11 |
10 |
| Retirements |
0 |
3 |
1 |
0 |
0 |
| Termination of fixed-term contract |
2 |
4 |
5 |
8 |
3 |
| Resignations |
9 |
3 |
4 |
3 |
7 |
| Resignations |
0 |
1 |
0 |
0 |
0 |
| Average turnover, % |
14.0 |
12.5 |
13.1 |
14.6 |
14.1 |
| Exit rate, % |
14.7 |
14.5 |
12.5 |
13.9 |
12.8 |
| Exit rate, resigned personnel, % |
12.0 |
3.9 |
5.0 |
3.8 |
9.0 |
Sick leave and accidents
|
2016 |
2015 |
2014 |
2013 |
2012 |
| Number of accidents leading to sick leave annually |
5 |
4 |
2 |
5 |
7 |
| Number of accidents during working hours annually |
1 |
1 |
1 |
2 |
1 |
| Deaths |
0 |
0 |
0 |
0 |
0 |
| Sick leave, including care for sick child (days per person-year) |
6.1 |
9.7 |
9.0 |
6.6 |
9.3 |
| Sick leave, excluding care for sick child (days per person-year) |
5.0 |
8.6 |
7.6 |
5.4 |
8.3 |
| Short sick leave periods (1-3 days), excluding care for sick child (days per person-year) |
2.6 |
3.0 |
2.5 |
2.3 |
2.6 |
| Total sick leave, excluding care for sick child (person-years) |
1.6 |
2.7 |
2.4 |
1.6 |
2.4 |
| Sick leave rate, including care for sick child (%) |
2.6 |
4.1 |
3.8 |
2.8 |
3.9 |
| Sick leave rate, excluding care for sick child (%) |
2.1 |
3.6 |
3.4 |
2.3 |
3.5 |
| Healthcare expenses (€ per person per year) |
465 |
657 |
721 |
596 |
669 |
| Personnel recreation expenses (€ per person per year) |
397 |
314 |
456 |
514 |
579 |
Education*
|
2016 |
2015 |
2014 |
2013 |
2012 |
| Master’s level degree, % |
61 |
63 |
58 |
55 |
53 |
| Bachelor’s level degree, % |
7 |
5 |
3 |
1 |
3 |
| Degree from a university of applied sciences, % |
12 |
12 |
10 |
11 |
12 |
| Secondary education degree + other degrees, % |
13 |
15 |
19 |
23 |
22 |
| No vocational qualification, % |
7 |
5 |
10 |
11 |
10 |
| Training days, per person per year |
5 |
5 |
5 |
4 |
5 |
| Training services purchased from third parties, € per person per year |
1,341 |
1,149 |
1,298 |
789 |
1,064 |
| *The distribution since the beginning of 2015 has been calculated for all employment relationships that had been in effect during the year, while earlier it was only calculated for those that were still in effect at the end of the year. |
|
|
|
Paid incentives (excluding social insurance payments)
|
2016 |
2015 |
2014 |
2013 |
2012 |
| EUR thousand |
551 |
505 |
492 |
319 |
307 |


